
Why Is Real-Time Visibility of Safety Metrics Across Jobsites Critical for Site Managers and Executives?
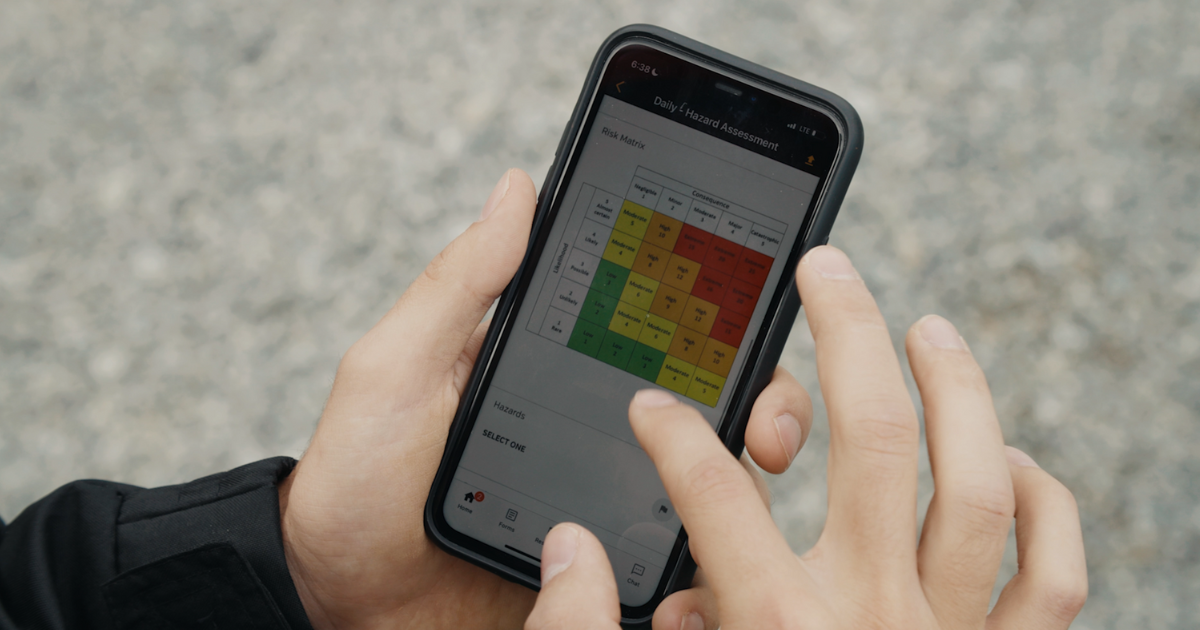
Site managers often juggle data from multiple projects, and when each site tracks safety activity differently, leaders lose time sorting through spreadsheets or incomplete reports. A digital safety monitoring tool brings field data into one dashboard so leaders can compare performance across locations and act quickly.
Real-time dashboards reveal leading indicators like inspections completed, open corrective actions, hazard reports, and training status, which helps the team recognize patterns that could lead to incidents if left unaddressed. Clear KPIs keep attention on the areas that influence daily safety outcomes because early visibility supports faster intervention. If corrective actions stall or hazard trends rise, supervisors can reach out to the site that needs help. This prevents small problems from growing into costly incidents and also helps keep crews aligned with company standards.
Executives benefit from having a high-level view of safety performance across the entire organization. With accurate, current data, they can justify resource needs, adjust staffing, and support sites that require additional oversight. This strengthens accountability and builds a more consistent safety culture.
Consolidated reporting also supports continuous improvement. Leaders can benchmark sites against one another, identify standout performance, and share best practices across teams. When data is centralized, patterns become clear, and improvement strategies become easier to define, and digital monitoring eliminates delays caused by paper logs or manual updates. Since information flows directly from the field, teams always work from the most current picture of risk.
Teams looking to improve visibility can explore the SiteDocs® Safety Monitor Solution. To learn more, visit the SiteDocs website or request a demo today.
Read More
How to Turn Field Safety Activity into a Broker-Ready Insurance Story
Learn how field safety records can become organized risk management data that supports workers’ comp renewal and broker conversations.

Leading vs. Lagging Safety Indicators: What Should You Track?
Learn the difference between leading and lagging safety indicators, which metrics to track, and how they give a clearer view of safety performance.

How to Build a Broker-Ready Workers’ Comp Renewal Kit
Learn how to organize safety records, leading indicators, incident data, and corrective actions into a broker-ready workers’ comp renewal kit.
SafeTrades NEW
Safety Consultant Program